Getting Started
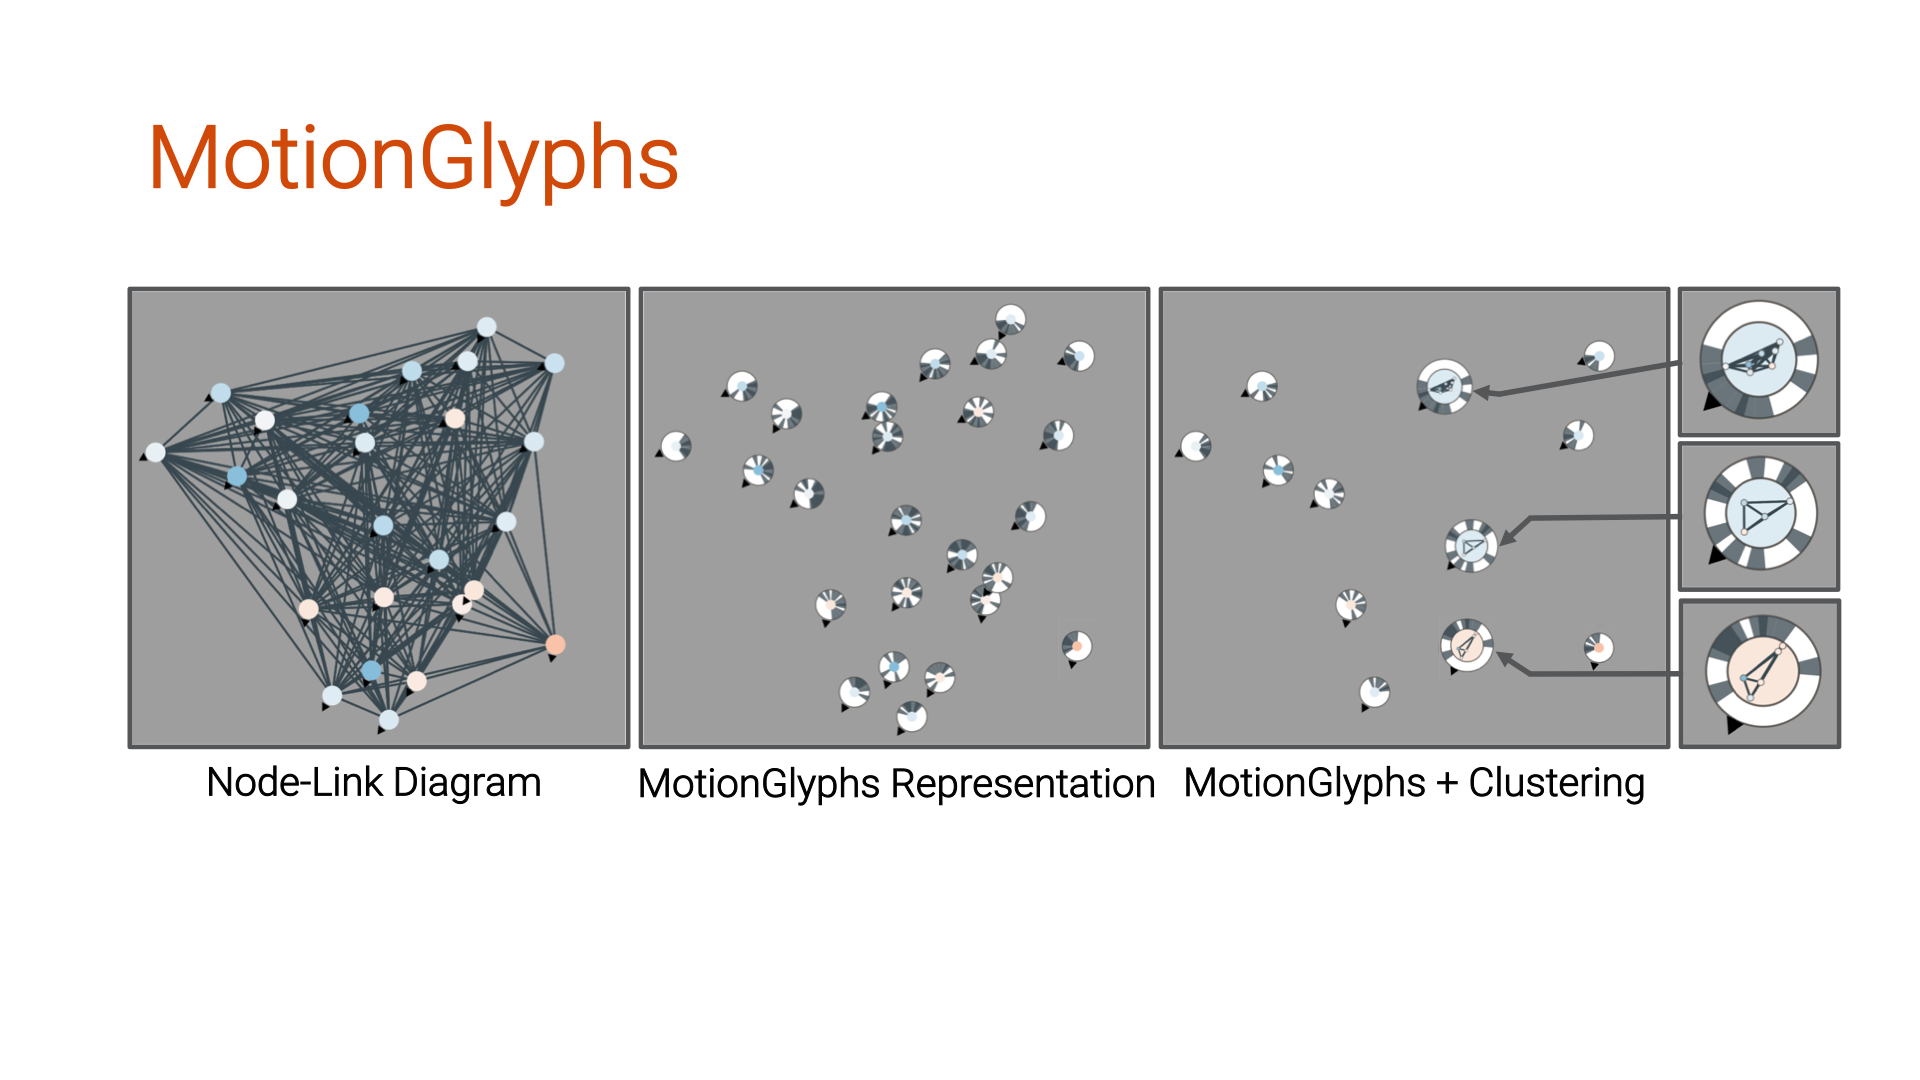
MotionGlyphs allows biologists to visually explore and abstract dense spatio-temporal network data in collective animal behavior. The figure presents the same time instance of golden shiner fish data in a node-link diagram (left), MotionGlyphs representation (middle), and with additional clustering (right). The color of the movers displays the speed (blue to red), and the links (light blue to dark blue) encode the similarity between movement properties (direction, speed, distance to each other). The example above shows how MotionGlyphs abstract relationships and aggregate movers into groups to reduce visual clutter and highlight different group structures.

The glyph for single movers. The single glyph displays one mover and abstracts the weighted network links. The arrow depicts the movement direction, and the inner-circle of the glyph allows to display characteristics of the mover (e.g., speed). The outer-ring of the glyph is essentially a doughnut chart with segments that aim to summarize median link weights to other movers that are positioned in a specific direction.
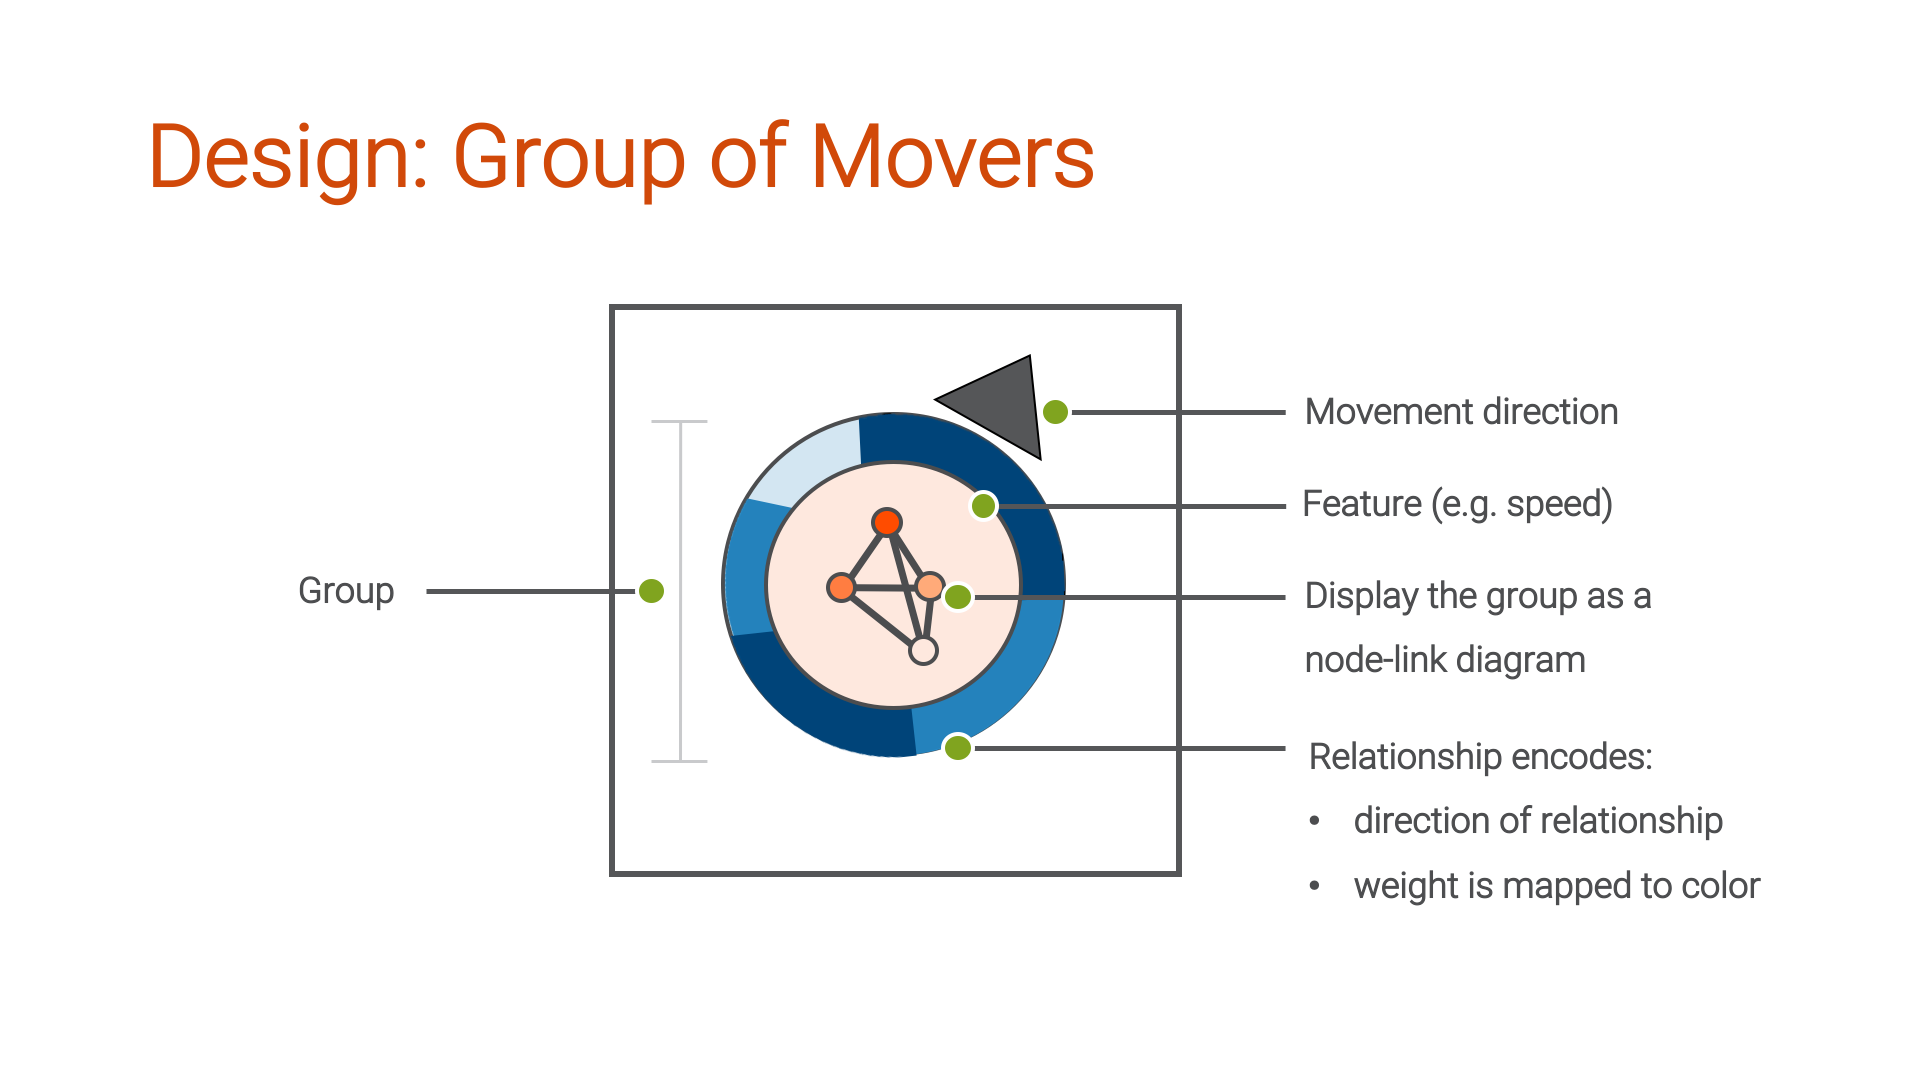
The cluster glyph abstracts a group of movers. The cluster glyph enables to present the underlying group structure of an applied ST-DBSCAN. We visualize the underlying group structure as an additional level of detail view for cluster interpretation to allow the exploration of the data at different scales. The inner-circle depicts the underlying spatio-temporal network of the group as an animated node-link diagram. The inner-circle also enables to display average attributes of the group (e.g., average speed) as the background color of the inner-circle. The node-link diagram in the center of the cluster glyph is also colored and encodes attribute information (e.g., speed) for the nodes and the links. The outer-ring of the cluster glyph displays the abstracted links to all other glyphs. The cluster glyph size is normalized and mapped to the number of nodes in the group